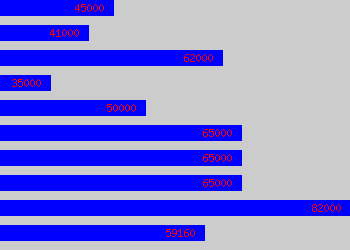
Operations Director Salary
£59,942
Job profile for a Operations Director
Fulfillment of sales, entailing; Logistics, transport and warehousing Project management and scheduling Engineers and manual labour Customer after-care Day to day duties of directing a management team for the above departments. Mid to long term duties of budgeting for profit and formulating overall Operations department strategy. Reporting to the M.D.
- Operations Director Job Profile
More Job Profiles >>>
If you are a Operations Director and you would like to share your current salary with us just like hundreds of other professional workers do every day, please do so with our salary calculator.
Add a comment on this job
Operations Director Salary Comparison
In 2008, the average salary for this job was £64,000.The average salary in 2009 was £56,420, based on 106 respondents (a difference of -12% from the 2008 figure.
The average salary in 2010 was £63,239, based on 143 respondents (a difference of 12% from the 2009 figure.
The average salary in 2011 was £58,137, based on 128 respondents (a difference of -8% from the 2010 figure.
The average salary in 2012 was £58,379, based on 74 respondents (a difference of 0% from the 2011 figure.
The median salary for a Operations Director based on all salary survey responses is: £55,000
Back to list of jobs beginning with O
Back to Salary Survey Home
About the Salary Survey Data in this survey is based on over 368,000 individual salary records. The date period for which job information was gathered varies, but is usually between 2008 - 2012. For precise date related information, custom reports may be ordered with greater granularity. Working 8 hours a day, 250 days of the year, the data suggests the hourly rate for Operations Director is £29.97.
Assorted Operations Director Salary Information
|  | ||||||||||||||||||||||||||||||||||||
Operations Director Salary By UK Region
|
With regard to age and impact on salary for a Operations Director, a statistical average weighting (that is based on how salary varies by age and not for a specific job which may vary considerably) suggests these figures: £44,957 for a worker in their 20s, £58,744 (30s), £69,533 (40s) and £69,533 (50s).
 View full salary data FAQs
Press enquiries Information on using the salary data and granularity |
View Jobs By Other Letter:
Number
A | B | C | D | E | F | G | H | I | J | K | L | M | N | O | P | Q | R | S | T | U | V | W | X | Y | Z

